


As you can see the annual 2011 temperatures for Milwaukee and Madison follow essentially the same trend. However there is one key factor that made winter in Milwaukee slightly warmer and summer slightly cooler than in Madison. What is causing this is Milwaukee's location on Lake Michigan. In the winter the body of water is slow to cool from an increase in temperature in the summer, therefore the water will often warm cooler air above it. Inversely, in the summer, water temperatures on Lake Michigan are cooler than the surrounding air. In effect, this cools air temperatures in the summer.


Comparing the day and night 2011 records for relative humidity in Milwaukee and Madison points out another difference between the climate near the Great Lakes and inland locations.Clearly values for the two cities are starkly different. To understand why this is we have to review some weather terms. First off, absolute humidity, which is the mass of water vapor divided by the mass of dry air in an air mass at a given temperature. Furthermore relative humidity is a ratio of present absolute humidity to the highest possible absolute humidity at the current air temperature. What is occurring to cause this noticeable difference between the cities is dependent on the difference in temperatures between Milwaukee and Madison. The trend I notice is that Madison has warmer temperatures and also has higher values for relative humidity for both day and night during the summer. I have also deducted that Milwaukee has higher temperatures and relative humidity values for night during the winter and spring. What this all comes down to is the principle that the warmer the air temperature, the more water the air-mass can hold. This is why relative humidity is higher in Madison in the summer months than in Milwaukee and why the relative humidity in Milwaukee is higher during the winter and spring.


Once again it easy to see how Lake Michigan creates such a difference in weather between two cities, which are only 80 miles apart. Average monthly rain averages are generally much higher for the summer and fall months in Madison than in Milwaukee, which is due to the higher relative humidity caused by overall warmer temperatures. As we discussed previously higher temperatures allow for a higher absolute humidity, which in turn allows for more water vapor to be held by clouds. Ultimately this causes the possibility for larger and more frequent storms, the result of which is evident in the records for rain averages. Conversely the slow warming water of Lake Michigan that keep temperatures warmer in Milwaukee than in Madison during the winter and spring months causes the same affect.


Climographs - I have constructed a series of climographs for airfields in Wisconsin and Minneapolis, MN, which span a time-frame from 1961 to 1990. These climographs are an incredibly not only for understanding weather trends during the time period, but also for comparing current records. By comparing the climograph data with current data it allows you to determine how certain times of the year varied from the norm.


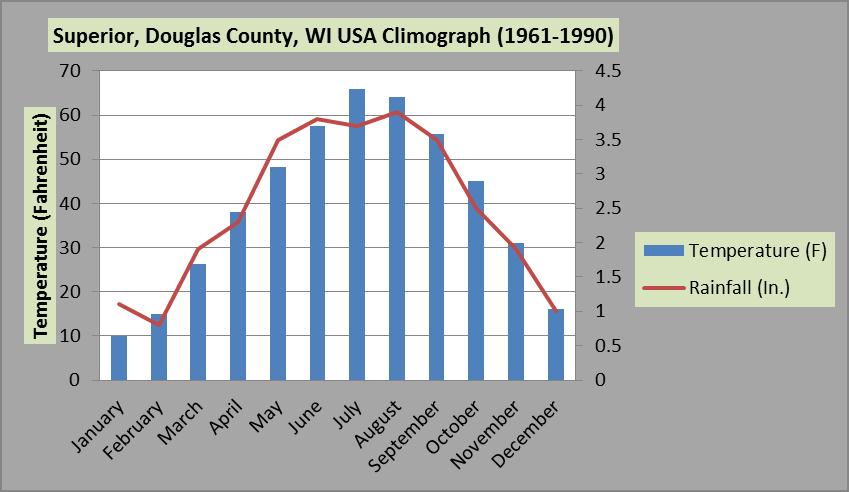

Through picking apart these climographs carefully there many interesting conclusions that can be made. First off relating back to back to the affect The Great Lakes have on cities on their coastlines, it is quite evident that Milwaukee and Superior both had less of a disparity between winter and summer temperatures than inland locations. They also experienced less of a peak in rainfall in the summer months compared to airfields located away from the Great Lakes. When comparing inland airfield records there is a strong trend of warmer winters the farther south the locations is. When comparing Minneapolis to Eau Claire for the month of January the temperature is about the same, with Minneapolis at 13 degrees Fahrenheit and Eau Claire at 11 degrees Fahrenheit. Madison however had a average temperature of 18 degrees Fahrenheit between 1961 and 1990. This trend of colder temperatures in these locations farther north gets into the influence of the continental polar airmass, which I talked about a lot in my posts. Locations farther north in Wisconsin and Minnesota get the brunt of continental polar air-mass and more often than locations like Madison and Milwaukee, which makes for colder winters in the north. It is not as much of a factor in the summer because the the continental polar air-mass shifts farther north into Canada and rarely dips down into Wisconsin and Minnesota.
Let's take a look at how Eau Claire's weather data, during the time I have kept this blog, stacks up against the data recorded in the climographs.


When observing the climograph and comparing the data for this January, it is very apparent that this has not been an ordinary January. The average temperature for January from 1961 to 1990 was 15 degrees Fahrenheit. This January there were only 8 days in which the temperature was at 11 degrees Fahrenheit or below. From 1961 to 1990 the average rainfall for January was approximately three-quarters of an inch. This January the rainfall was slightly higher than the average, with just under an inch, despite precipitation only occurring on 5 days. The predominant wind direction was by far from a W direction. To sum up January this year compared to the average it was much warmer and we received slightly more rainfall.


February was really a oddball month for weather in Eau Claire and the rest of Wisconsin, atleast in terms of weather. From 1961 until 1990 the average February temperature in Eau Claire was approximately 16 degrees. This February the mean temperature dropped to and below 16 degrees Fahrenheit for only three days. There were only four days of precipitation in February, that equaled about the average amount of rainfall (0.6 inches) for February from 1961-1990. This February wind direction was predominately out of the west.


This March was an absolute freak of a month by Wisconsin standards. The average temperature in Eau Claire from 1961-1990 was approximately 29 degrees Fahrenheit. This March the mean temperature never even touched 29 degrees Fahrenheit. More impressively the minimum temperature for this March only hit 29 degrees Fahrenheit three times. If you recall to the post I made about that "Omega High", which was causing the jet stream to peak way north of Wisconsin and allowed for warm air from the Gulf of Mexico to move unimpeded northward. It is easy to see the period over "Spring Break", where temperatures rose due that Omega High. The predominant wind direction in fell in between the E to S orientation.


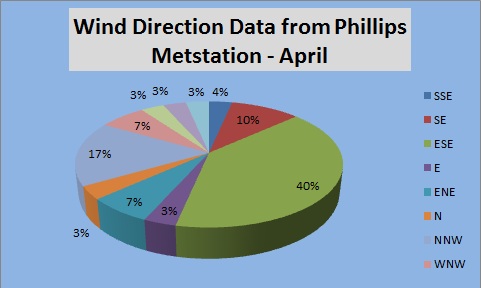
Despite the above average temperatures January through March, April was a return to normalcy in temperatures. The average temperature in April from 1945 was about 45 degrees Fahrenheit and this April the mean temperature was in that ballpark.The predominant wind direction in April was from S to ESE.
So what does predominant wind direction for each have to do with anything? Well if you look at the months from January until April, March and April received the most rainfall. March and April also had predominantly S to E wind directions. The correlation between S to E wind direction and higher precipitation is due to more frequent mid-latitude cyclones drawing up moist warm unstable air through that S to E wind direction.
No comments:
Post a Comment